
No matter what field you are part of, measuring Key Performance Indicators, commonly known as KPIs is crucial to measure success. The simple principle applies to the maintenance of your machines as well.
KPI for maintenance vary as per the requirements, goals, strategies and action plans of a company. However, there are certain indicators that are common for all.
In this article, we will cover all the Common KPIs that can be part of your predictive maintenance metrics. Let’s get started….
Downtime
The purpose of this indicator is to track, monitor and evaluate the asset’s reliability. Downtime tracks the “total time when the equipment was offline”, which means that some problem occurred with the machine which requires intervention from the technician.
The ideal percentage for this KPI is 10%, meaning, the machine should be fully operational at least 90% of the time.
When working with Data you will quickly see what downtime was caused due to incorrect handling of the machine. This is the quickest way of eliminating unnecessary downtime.
This KPI also comes in handy when you are working on a predictive maintenance strategy with the objective of keeping downtime below average as well as minimising the risk of unplanned shutdowns.
Maintenance Backlog
It is a time indicator that stands for “maintenance delays”. The backlog records the time needed to perform a reactive, preventive or predictive work order, quality control, improvements or any other activity that promotes a machine’s desirable performance. To calculate this KPI, you need to consider all the workflow maintenance planning and control.
The formula is:
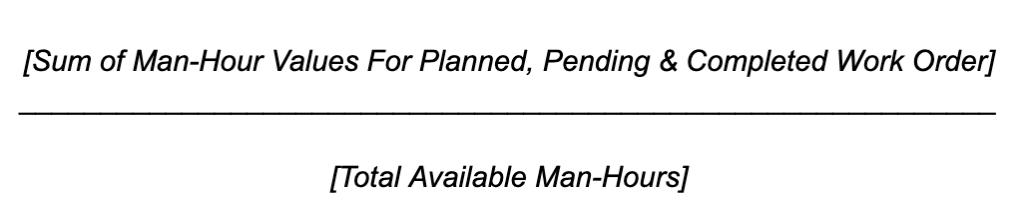
NB: Only consider the “productive time” of each technician because they are not executing work orders 100% of the time.
The maintenance backlog is measured in working days/weeks or months. The ideal duration is 2 weeks, however, for companies that work 24/7, the ideal duration is between 3 to 4 weeks. The benefit of measuring this KPI is to determine how efficient your team is, as well as determine the causes of unproductivity.
MTBF - Mean Time Between Failures
This indicator measures the reliability of the machines. It considers unplanned failures, including the ones occurring from software failures and manufacturing defects.
Since we need to determine the “time elapsed” between each failure, MTBF is measured in time (hours, days, weeks or months). The rule of thumb is that the “longer the MTBF”, the more reliable a machine and vice versa.
The formula to calculate MTBF is:
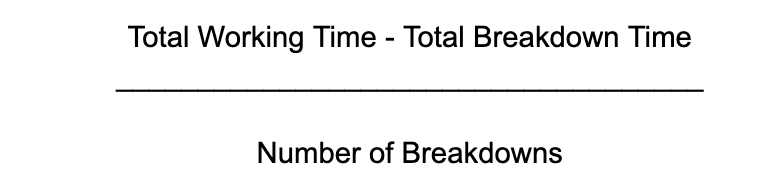
As such there is no ideal number for this KPI because it varies from business to business, however, MTBF should be as high as possible. In some industries, this KPI is used to push product sales as a unique selling point.
MTTR - Mean Time To Repair
This indicator measures how much time it takes for your team to perform corrective maintenance after a machine failure happens. Unlike MTBF, MTTR should be as low as possible. The formula to calculate MTTR is:

This way you can calculate the time (hours, days, weeks or months) when a machine was offline. Similar to MTBF, there is no ideal number for MTTR as well, however, it is important to keep this KPI as low as possible.
OEE - Overall Equipment Effectiveness
The most important KPI for the manufacturing industrie, OEE measures the “overall effectiveness of equipment” which allows you to determine whether your processes are working efficiently or not. A rough benchmark for this KPI is at least 77%.
One of the key benefits of measuring OEE is understanding how often your machines are available to work. It will help you discover how fast the manufacturing process is as well as how many products/services are manufactured without any unexpected failure.
The formula to calculate OEE is:

Availability is calculated on the basis of downtime and uptime. Performance is calculated by comparing current production against projections. Quality is calculated from total production minus faulty production.
Even though the benchmark for OEE is 77%, however, the top companies in the world like to keep the OEE between 85% and 99%. International companies can provide preset OEE dashboards to subsidiaries or various locations of production in order to keep the KPI comparable.
PMP - Planned Maintenance Percentage
This indicator considers the time spent on planned activities such as maintenance, repairs or replacements. This KPI is directly linked to the company’s Preventive Maintenance Plan.
The formula to calculate PMP is:
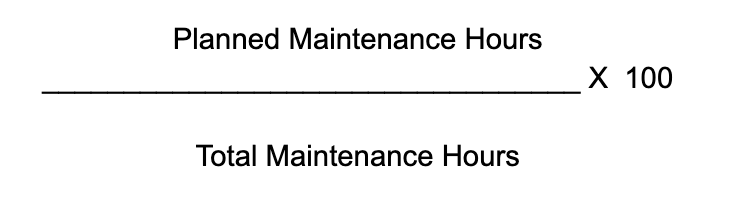
The ideal number for PMP is at least 85%.
Schedule Compliance or Planned Maintenance Compliance
This indicator determines the effectiveness and commitment your technicians and managers showed on their planned tasks. In simple words, Schedule Compliance measures the performance of your whole team.
The formula to calculate Schedule/Planned Maintenance Complaice is:
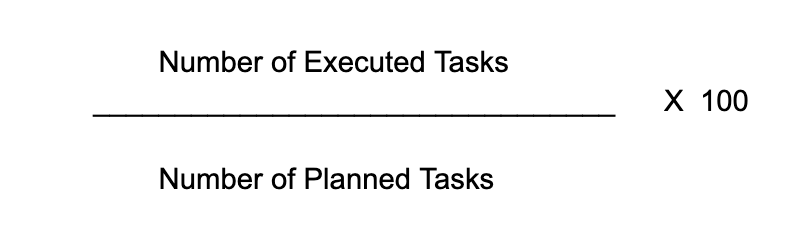
The ideal number for schedule compliance is at least 90%. This means that productivity is high with minimal machine failures.
Conclusion
The primary advantage of calculating these KPIs is that it will help you gain deep insights into internal processes and activities, allowing you to determine what is working and what is not and how can you fix the issues.
Therefore allowing, you to improve revenues and profits. An Industrial IoT solution like Paze can help you to stay on top of your numbers and have the most important KPIs live on hand even across multiple locations.